LOW PRODUCTIVITY
IS THE MIND KILLER
DVT Eclipse IDE and DVT IDE for Visual Studio Code are integrated development environments (IDEs) that significantly improve productivity for design and verification engineers.
What makes
the work of RTL
designers hard?
- Huge and complex projects, with millions of lines of code
- Extensive IP reuse with no time to know every detail
- Multiple formats and languages
- Tight deadlines
How does
AMIQ DVT IDE help?
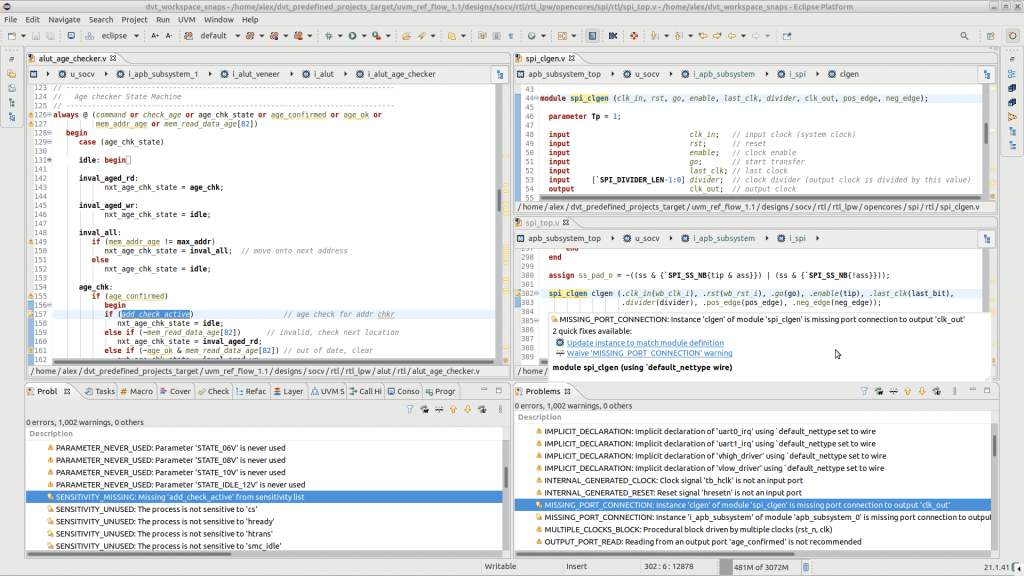
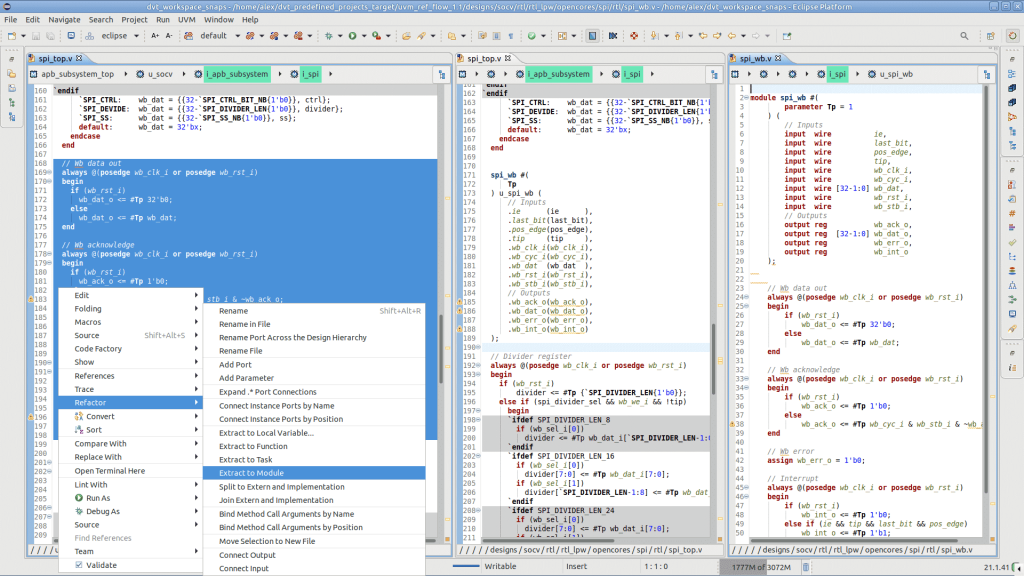
Incrementally compiling and elaborating RTL design code as you type it in
This detects a wide variety of common errors on the fly, ranging from simple typos to tricky syntactic and semantic errors in RTL constructs. It is much more efficient to find and fix these errors at the coding stage without having to wait for simulation or synthesis. The IDE offers “quick fix” suggestions for many types of errors. SystemVerilog, Verilog, and VHDL are all supported equally well.
1
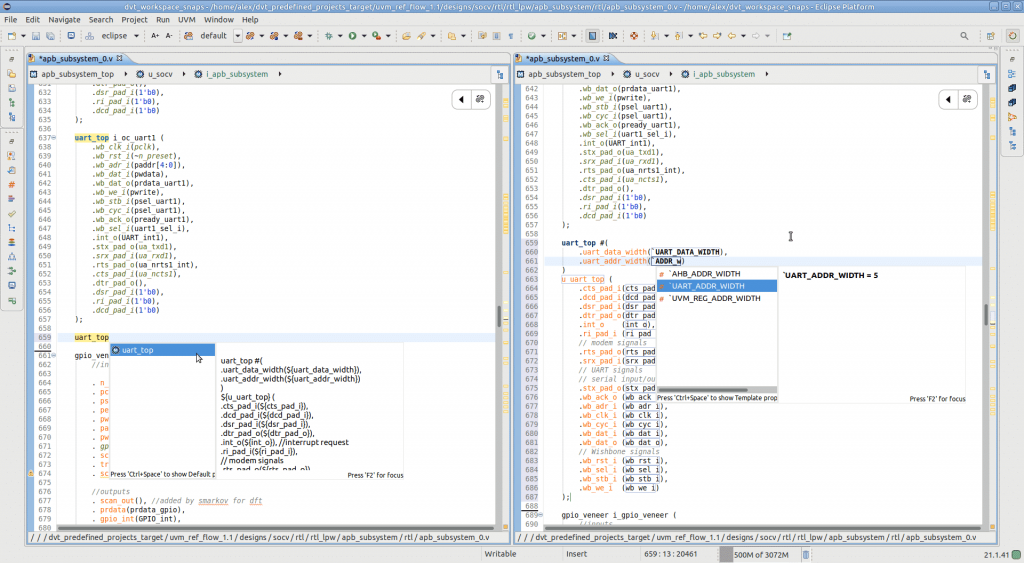
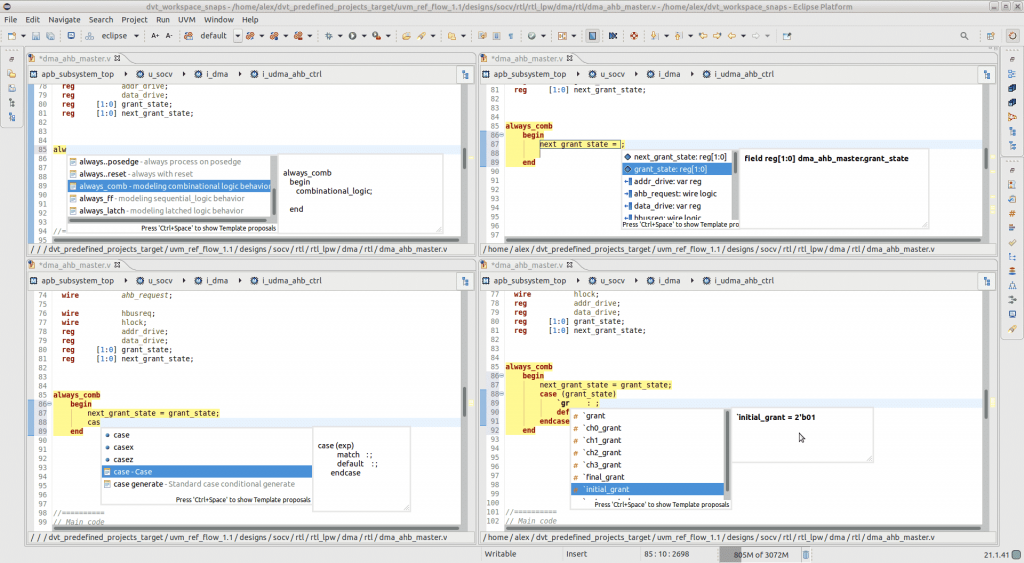
Auto-completing code
This makes it faster to enter and modify RTL code, and it eliminates tedious searches to find exact names. This also accelerates language learning for new users and helps even experienced designers, who may have trouble keeping all the syntax in their heads.
2
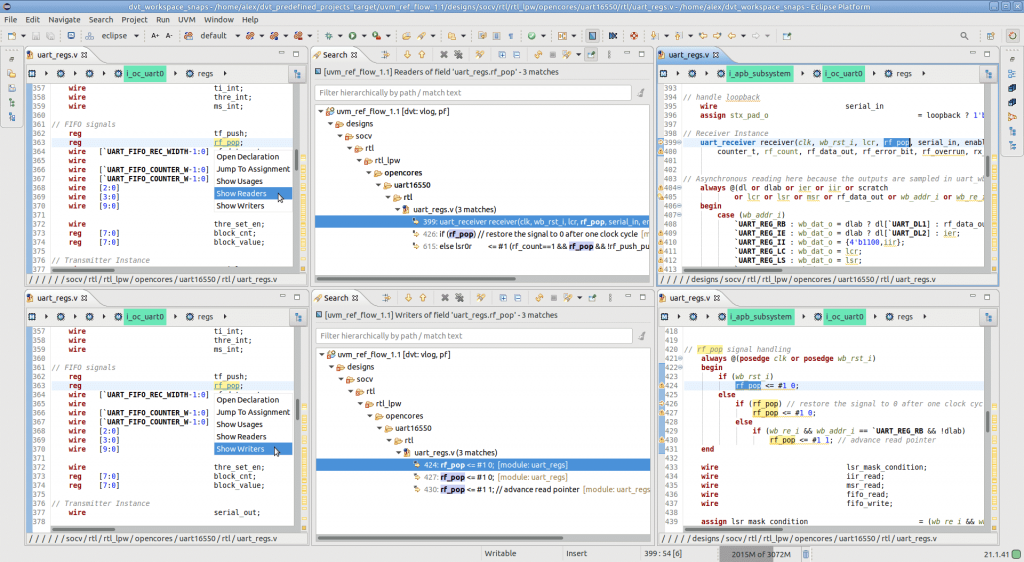
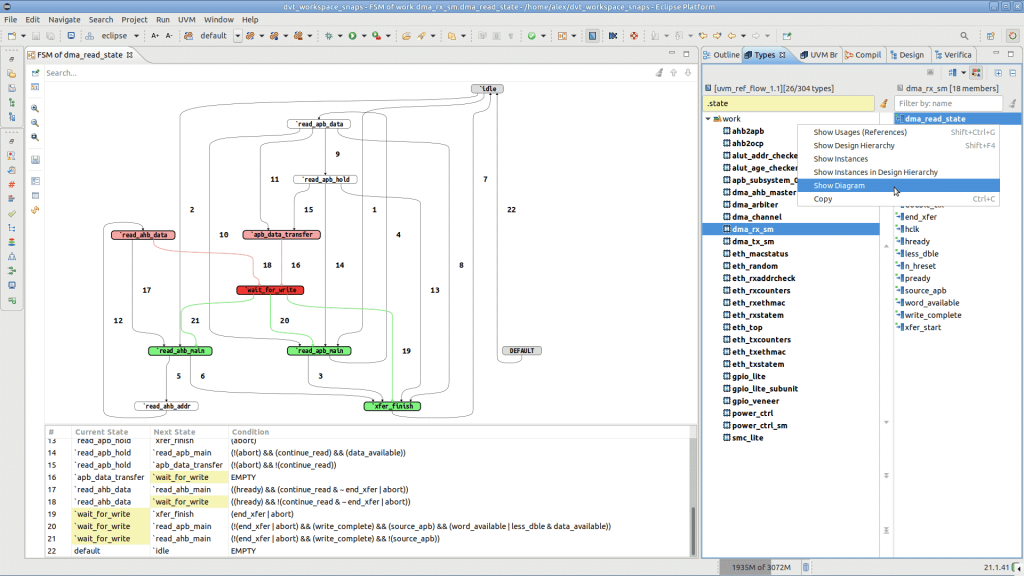
Building a complete model of your design and providing multiple views
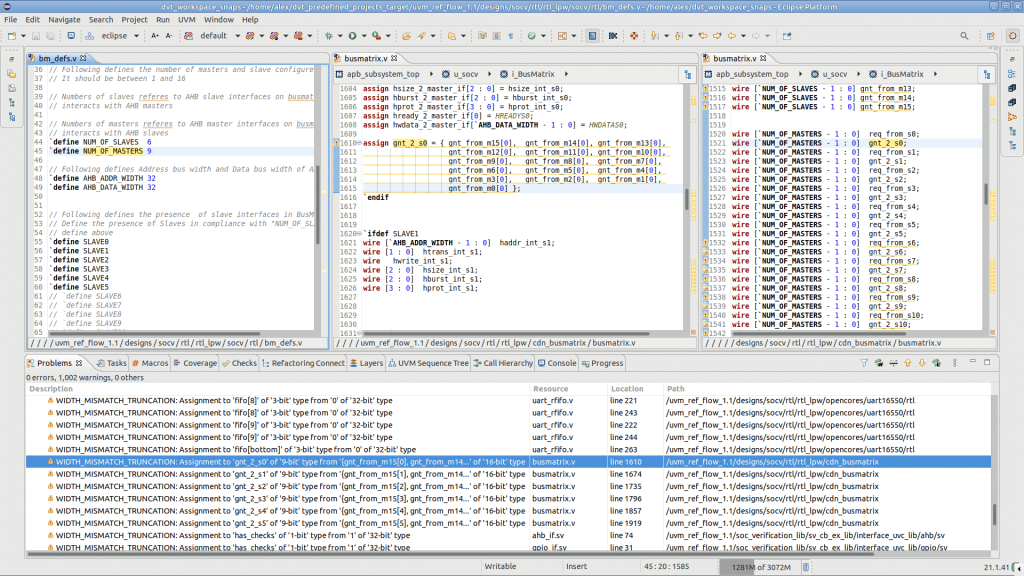
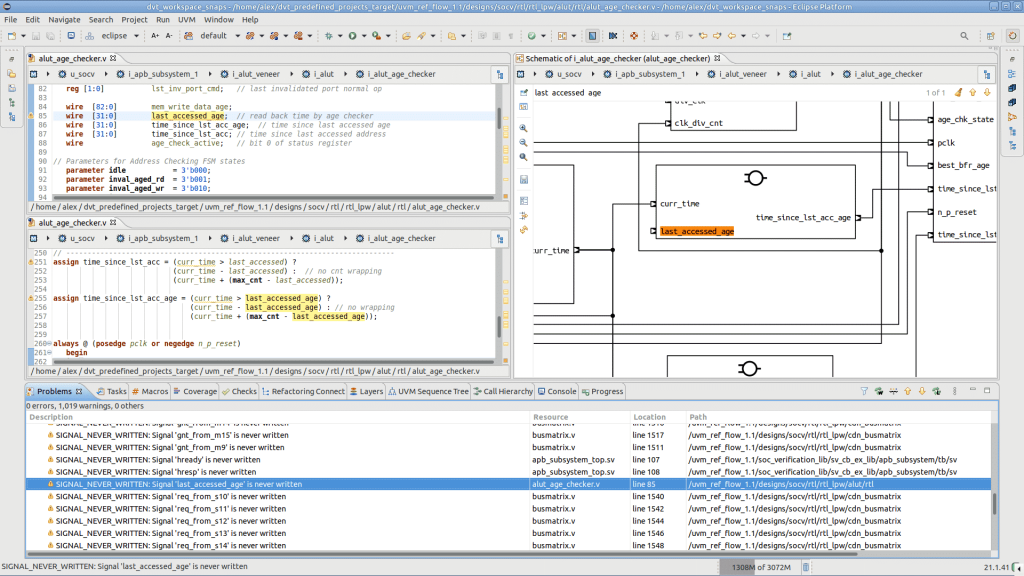
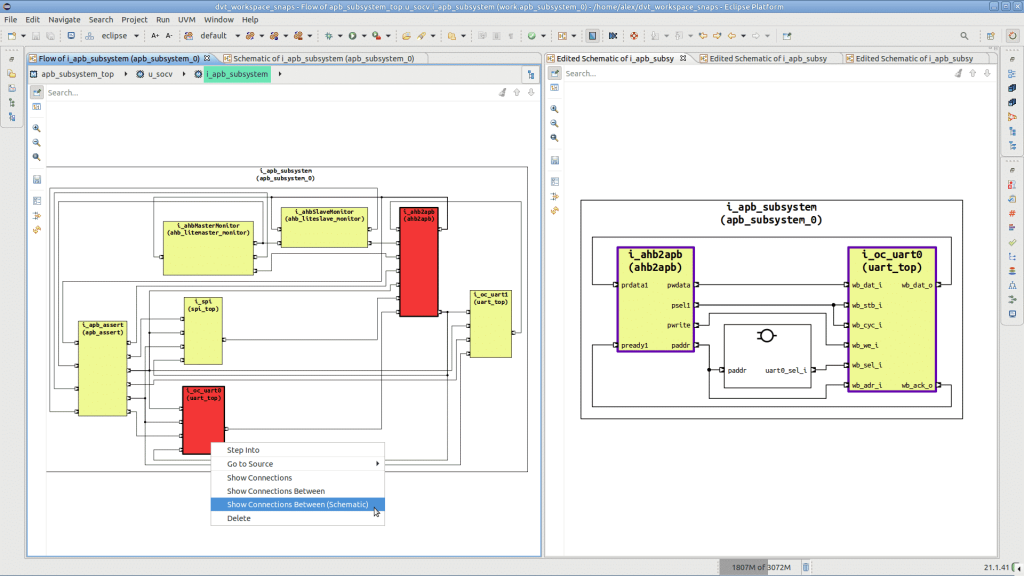
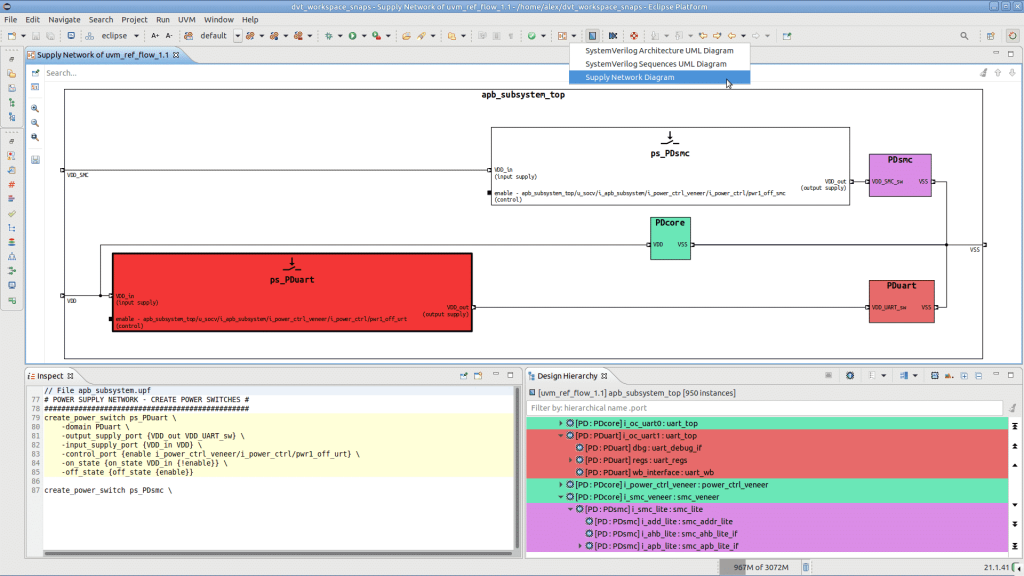
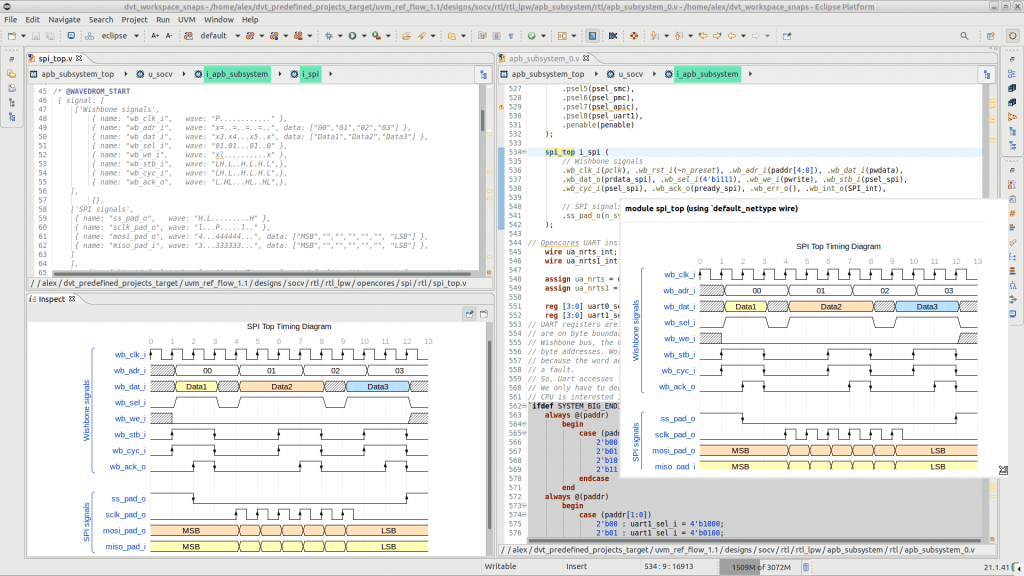
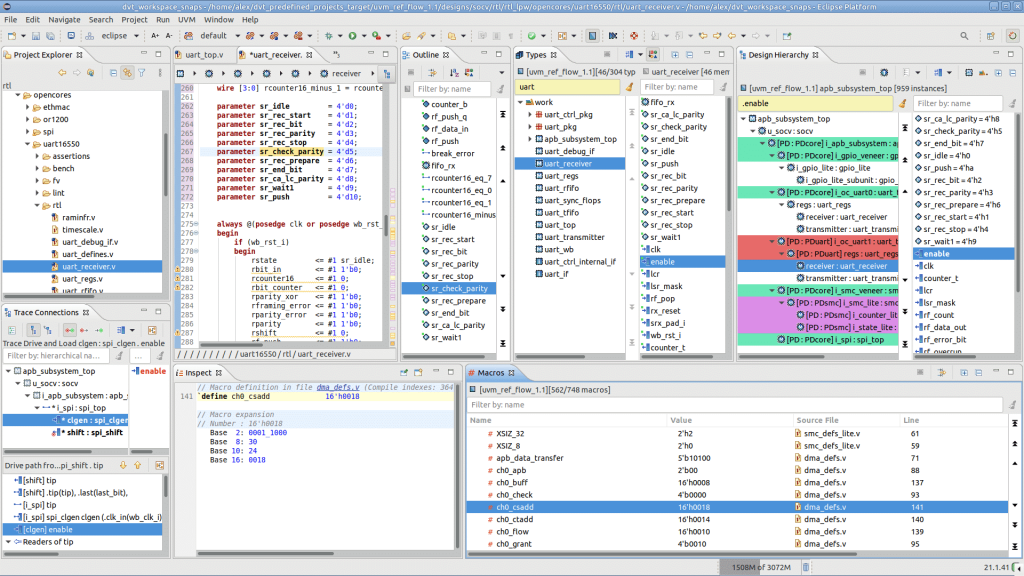
This provides a comprehensive view of how all the blocks fit together, making it easy to trace signals through multiple modules and levels of hierarchy. With its complete knowledge of the design structure, the IDE can offer a range of different views to help you in understanding and modifying the design.
These make it much easier to understand your design, especially when some portions are IP blocks or code inherited from other chip projects. The views are synchronized and hyperlinked, with breadcrumbs so you always know where you are in the design hierarchy.
3
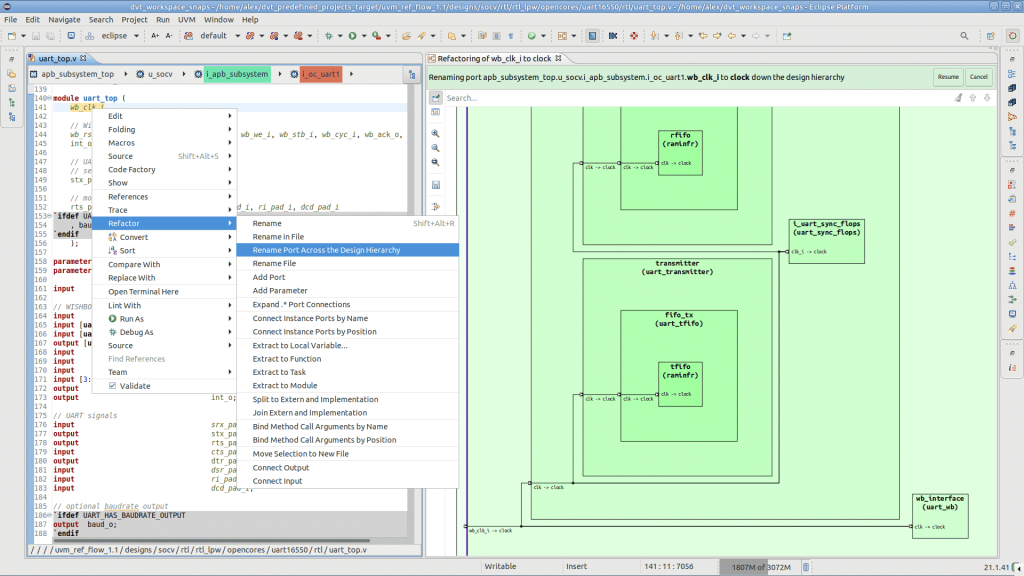
Refactoring your RTL code
This improves code comprehensibility and maintainability, without changing its functionality. It can also yield better simulation performance and synthesis results.
4
Supported Languages
Why should you switch from a traditional text editor?
Text editors have no notion of signal connectivity between design files, so they have no model of the complete design. To trace signals, you must do many manual text searches across multiple files. Text editors cannot generate graphical views such as schematics and power supply network diagrams. There is no way that they can provide the same capabilities as DVT IDE.

“I use DVT Eclipse plugin every day, and all this time it has given me an edge when it comes to debugging and understanding the RTL. If you are reading this, don’t hesitate! Go for it! DVT Eclipse is really good!”
Cristian Ramos-Espinoza
Senior Digital Design Engineer
About AMIQ
AMIQ EDA provides tools – DVT Eclipse IDE, DVT IDE for Visual Studio Code, DVT Debugger Add-On, Verissimo Linter, and Specador Documentation Generator – that enable design and verification engineers to increase the speed and quality of new code development, simplify legacy code maintenance, accelerate language and methodology learning, improve source code reliability, and automate user documentation. The result is better design and verification code, developed faster and with fewer resources, in a shorter time to market.
Working with 150+ companies in 30+ countries, we are recognized for our high quality products and customer responsiveness.

